#Platform Businesses Are Reshaping Wealth Creation
Platform businesses have changed the rules of the game. The top 20 platform companies now hold a combined market value of over $22.9 trillion. That shift from an asset-heavy to an asset-light business model is a fundamental change in structure, as well as how value is built and distributed.
The core engine driving this? Network effects. Every new user on a platform makes the service more valuable to everyone else. That loop creates compounding returns not just for the business but for investors too.
#Why Retail Investors Are Better Positioned
Institutional investors often have to stick to predefined sectors. Retail investors don’t. You can build a portfolio that captures platform growth across industries, from AI to e-commerce to cloud computing.
Over the last 18 months, several top platform businesses have delivered standout returns, ranging from over 100% to more than 700%. That includes both established giants like Meta (+103%) and Netflix Inc (NASDAQ:NFLX) (+167%), as well as fast-growing challengers like Palantir Technologies Inc (NYSE:PLTR) (+767%) and Spotify Technology SA (NYSE:SPOT) (+273%). What do they have in common? Most operate with structural moats that traditional models can’t easily replicate:
Switching Costs: Once you're in, it's hard to leave
Data Scale: More users = more data = better products
Ecosystems: Complementary services and tools deepen user engagement
Brand Strength: Supercharged by the size of the network
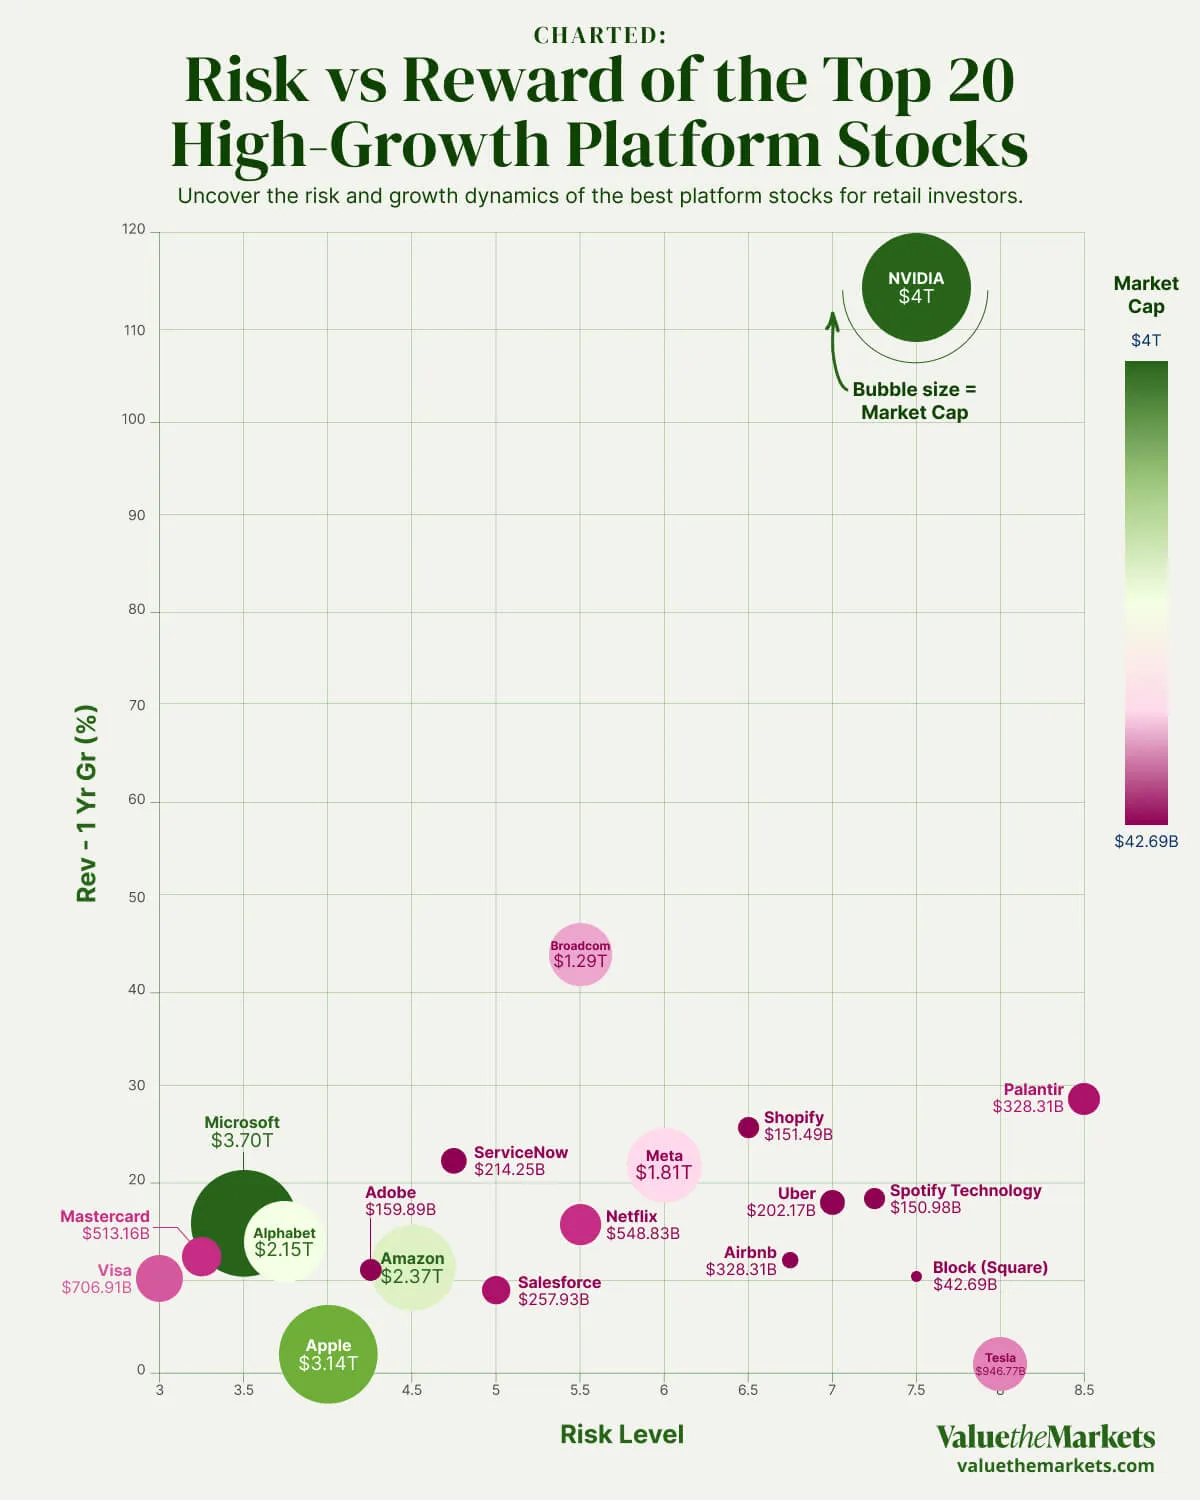
#The Risk-Reward Heatmap
Platform businesses don't all carry the same level of risk. That’s where a heatmap becomes useful. It visually maps out platform companies by:
Risk Level (X-Axis): From 1 (low risk) to 10 (high risk)
Growth Rate (Y-Axis): Annual revenue growth in %
Bubble Size: Market cap of each company
Bubble Color: Risk/Reward Category
| Company | Ticker | Market Cap | Risk Level | Revenue Growth (%) | Growth Category |
| Microsoft Corporation | MSFT | $3,699,325,732,488 | 3.5 | 15.7% | Balanced Leaders |
| NVIDIA Corporation | NVDA | $3,861,056,000,000 | 7.5 | 114.2% | High Growth, Higher Risk |
| Apple Inc. | AAPL | $3,135,776,668,700 | 4 | 2.0% | Balanced Leaders |
| Amazon.com Inc. | AMZN | $2,372,436,272,392 | 4.5 | 11.0% | High Growth, Higher Risk |
| Alphabet Inc. | GOOGL | $2,149,879,640,000 | 3.75 | 13.9% | Balanced Leaders |
| Meta Platforms Inc. | META | $1,806,166,979,319 | 6 | 21.9% | High Growth, Higher Risk |
| Tesla Inc. | TSLA | $946,767,868,661 | 8 | 0.9% | High Growth, Higher Risk |
| Broadcom Inc. | AVGO | $1,289,597,673,022 | 5.5 | 44.0% | Balanced Leaders |
| Visa Inc. | V | $706,905,289,440 | 3 | 10.0% | Low Risk, Moderate Growth |
| Mastercard Inc. | MA | $513,155,872,710 | 3.25 | 12.2% | Low Risk, Moderate Growth |
| Salesforce Inc. | CRM | $257,928,800,000 | 5 | 8.7% | Low Risk, Moderate Growth |
| Adobe Inc. | ADBE | $159,893,706,000 | 4.25 | 10.8% | Low Risk, Moderate Growth |
| Netflix Inc. | NFLX | $548,825,216,059 | 5.5 | 15.6% | Low Risk, Moderate Growth |
| ServiceNow Inc. | NOW | $214,247,070,000 | 4.75 | 22.4% | Balanced Leaders |
| Uber Technologies | UBER | $202,174,131,715 | 7 | 18.0% | High Growth, Higher Risk |
| Palantir Technologies | PLTR | $328,311,012,671 | 8.5 | 28.8% | High Growth, Higher Risk |
| Shopify Inc. | SHOP | $151,494,859,987 | 6.5 | 25.8% | High Growth, Higher Risk |
| Airbnb Inc. | ABNB | $86,014,982,145 | 6.75 | 11.9% | High Growth, Higher Risk |
| Block Inc. (Square) | XYZ | $42,688,468,790 | 7.5 | 10.1% | High Growth, Higher Risk |
| Spotify Technology | SPOT | $150,980,927,661 | 7.25 | 18.3% | High Growth, Higher Risk |
#What the Heatmap Tells You
Low Risk, Moderate Growth
Visa, Mastercard, Salesforce, Adobe, and Netflix represent the most stable of the high-growth platform cohort. Their platforms are deeply embedded in global commerce, productivity, and entertainment. While their average growth sits at a more measured 11.46%, they offer consistency and lower volatility, ideal for investors seeking platform exposure with less day-to-day risk.
High Growth, Higher Risk
This is the frontier of platform innovation. Nvidia, Amazon, Meta, Tesla, Uber, Palantir, Shopify, Airbnb, Block, and Spotify are building the next generation of digital infrastructure, from AI chips to marketplaces, mobility, and creator economies. They average over 26% growth but come with higher risk. These are platforms with breakout potential, often trading growth for near-term predictability.
Balanced Leaders
Microsoft, Apple, Alphabet, Broadcom, and ServiceNow sit in the sweet spot. These platforms are still scaling, with an average growth rate above 19%, but with risk levels that remain well-managed. They combine enormous reach with expanding ecosystems, making them foundational players in the global platform economy.
#Market Concentration and Scale
The data reveals significant market concentration among platform leaders:
Total Market Cap: $22.9 trillion across 20 companies
Average Growth Rate: 20.81% annually
Top 5 Companies: Control $15.5 trillion (67% of total market cap)
Growth Distribution: 50% classified as "High Growth, Higher Risk"
#How to Use This as an Investor
Portfolio Construction
Don’t load up on one type. Mix low-risk giants with a few high-growth disruptors. That way, you get stability and potential upside.
Trend Spotting
Use the heatmap to track which companies are reducing risk or accelerating growth. Over time, today’s disruptors may graduate into tomorrow’s blue chips.
Storytelling
Every company on that chart has a story, from early struggles to category dominance. Use those journeys to sharpen your investment thesis.
The Bigger Picture
Platform businesses aren’t just another tech trend. They’re the infrastructure of the digital economy. For retail investors, that means access to companies building massive competitive moats with network effects that only get stronger over time.
The opportunity isn’t just to chase returns. It’s to understand how value is created in this new era and own a piece of it while it’s still evolving.